Showing posts with label Taxonomy. Show all posts

Monday, January 2, 2017

A nested model for visualization design and validation

Note

4 layers nested model to analyze and evaluate the visualization design. The layers are:

  1. Domain problem and data characterization: the designer should follow the "vocabulary" in each domain, e.g. business or biology.  
  2. Operation and data type abstraction: data type transformation
  3. Visual encoding and interaction design: the cost of interaction
  4. Algorithm Design: run-time speed and time

To evaluation:

  1. Vocabulary: to discuss the terminology in different domains
  2. Interactive Loops and Rapid Prototyping: looping and refining. 
  3. Domain Threats: mischaracterized problem
  4. Abstraction Threats: not solve the characterized problem the target users.
  5. Encoding and interaction Threats: not effective communication. 
  6. Algorithm Threats: memory performance.

Reference
  1. Munzner, Tamara. "A nested model for visualization design and validation." IEEE transactions on visualization and computer graphics 15.6 (2009): 921-928.

A design space of visualization tasks

Note

A taxonomy for data visualization tasks. The author defines the design space dimensions as:

  • Goal: Exploratory Analysis (e.g. undirected search), Confirmatory Analysis (directed search), Presentation (exhibiting confirmed analysis results) 
  • Means: Navigation (e.g. browsing or searching), (Re-)organization (e.g. extraction, abstraction), Relation (e.g. variations, discrepancies)
  • Characteristics: Low-level (e.g. values, objects) & High-level (e.g. trends, outliers, clusters, frequency, distribution, correlation, etc.) data characteristics
  • Target: Attribute Relations (e.g. Temporal and Spatial relations), Structural relation (e.g. causal relations, topological relations)
  • Cardinality: Single (highlight detail), Multiple (putting data into context), and All Instances (getting the overview). 


The classification can be used as the semantic tuple, i.e. (exploratory, search, trend, attrib(variable), all). This tuple is used to calculate the suitable techniques.

Reference
  1. Schulz, Hans-Jörg, et al. "A design space of visualization tasks." IEEE Transactions on Visualization and Computer Graphics 19.12 (2013): 2366-2375.

Interactive dynamics for visual analysis

Note

A taxonomy of tools that support the fluent and flexible use of visualizations.

Pay attention more to Coordinate and Organize sections.

Reference
  1. Heer, Jeffrey, and Ben Shneiderman. "Interactive dynamics for visual analysis." Queue 10.2 (2012): 30.

Task taxonomy for graph visualization

Note

A graph-specific visualization consists of Nodes, Links, Paths, Graphs, Connected Components, Clusters, and Groups. This paper discussed the possible tasks to examine the tool based on the given objects.

The low-level tasks, included:

  • Retrieve value
  • Filter
  • Compute the Derived Value
  • Find Extremum
  • Sort
  • Determine Range
  • Characterize Distribution
  • Find Anomalies
  • Cluster
  • Correlate
Tasks which commonly encountered while analyzing graph data: 
  • Topology-based Tasks: adjacency (direct connection), accessibility (direct or indirect connection), common connection, connectivity
  • Attribute-based Tasks: On the Nodes, On the Links
  • Browsing Tasks: Follow path, Revisit
Some more high-level tasks: 
  • compare two web graph for the difference, e.g. two recipe graph. 
  • nodes duplication
  • some tasks need users' interpretation
Reference
  1. Lee, Bongshin, et al. "Task taxonomy for graph visualization." Proceedings of the 2006 AVI workshop on BEyond time and errors: novel evaluation methods for information visualization. ACM, 2006.

Sunday, January 1, 2017

Information visualization and visual data mining


Note

A good survey paper to follow the trend of data visualization and mining. This paper provides a clear classification for visual data mining works.  The author describes: "The visual data exploration process be seen a hypothesis generation process". A visualization interface provides the user an overview of the dataset. Based on the insight, the user can explore/filter/verify the finding to answer the hypothesis, the hypothesis can be generated by user/statistics/machine learning. In another hand, a visual data exploration usually follows a three looping process: overview, filter, and detail-on-demand. The different insight will jump out while the user explores the data through designed interface.

A visual data mining has consisted with three components: 1) data type to be visualized:  1D, 2D, ND, Text and hypertext and algorithm data visualization; 2) visualization technique: standard 2/3D, geometrically transformed, icon-based, dense pixel and stacked display; 3) interaction and distortion technique: projection, filtering, zooming, interactive distortion, linking and brushing. Each categories is with a reference paper that worth to further reading.

Reference
  1. Keim, Daniel A. "Information visualization and visual data mining." IEEE transactions on Visualization and Computer Graphics 8.1 (2002): 1-8.

Friday, December 30, 2016

A visual analytics agenda

Note

This paper points out the potential research directions for visual analytics.

  • let user obtain deep insight, assessment, planning and decision making. 
  • let user see, explore and understand large amounts of information simultaneously
  • convert all types of conflicting and dynamic data in ways that support visualization and analysis.
  • communicate the information in the appropriate context to a variety of audiences. 
The science of analytical reasoning, take a crisis event as example.
  • understanding historical and current situations. 
  • identifying possible alternative future scenarios
  • monitoring current events to identify both expected and unexpected events. 
  • determining indicators of the intent of an action or an individual.
  • support the decision maker in times of crisis. 

visual representations and interaction technologies

  • facilitate understanding of massive and continually growing collections of data of multiple types. 
  • provide frameworks for analyzing spatial and temporal data
  • support the understanding of uncertain, incomplete, and misleading information. 
  • provide user and task-adaptable guided representations that enable full situation awareness while supporting development of detailed actions. 
  • support multiple levels of data and information abstraction, including integration of different types of information into a single representation. 
Data representations and transformations
  • transforming data into new scalable representations that faithfully represent the underlying data's relevant content. 
  • synthesize different types of information from different sources into a unified data representation, so users can focus on the data's meaning in the context of other relevant data
  • develop methods and principles for representing data quality, reliability and certainty, measure through-out the data transformation and analysis process. 

Reference
  1. Thomas, James J., and Kristin A. Cook. "A visual analytics agenda." IEEE computer graphics and applications 26.1 (2006): 10-13.

Thursday, December 29, 2016

A Tour through the Visualization Zoo

Note

This paper introduced the basic figure plots for data visualization. The mentioned schemes included:
  • Time Series Data: Index Chart


  • Time Series Data: Stacked Graph


  • Time Series Data: Small Multiples


  • Statistical Distribution: Horizon Graph


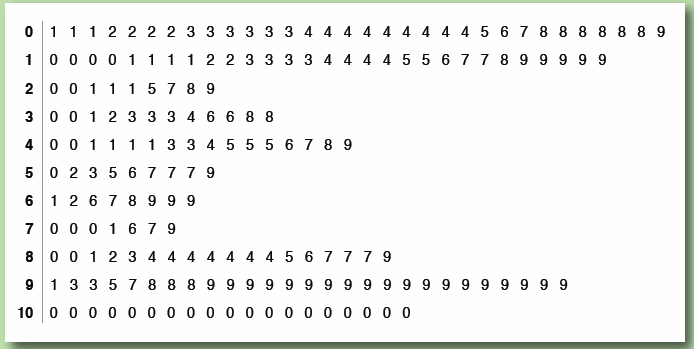
  • Statistical Distribution: Stem-and-Leaf Plot


  • Statistical Distribution: Q-Q Plots
  • Statistical Distribution: Scatter Plot

  • Statistical Distribution: Parallel Coordinates

  • Maps: Flow Map


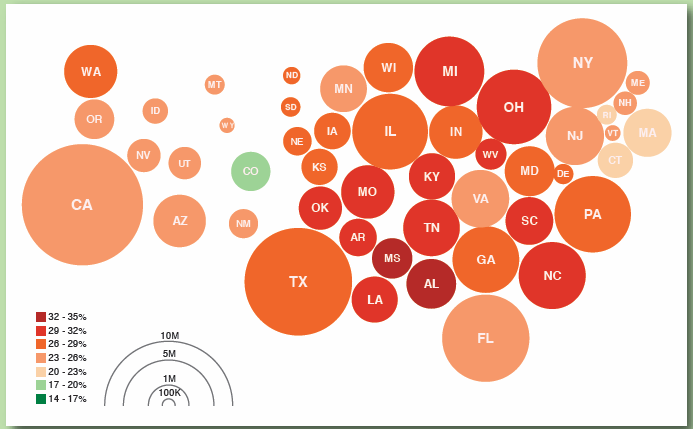
  • Maps: Choropleth Map

  • Hierarchies: Node-Link


  • Adjacency Diagrams: Lcicle Tree Layout

  • Adjacency Diagrams:Enclosure Diagrams


  • Network: Treemap


  • Network: Nested Circles

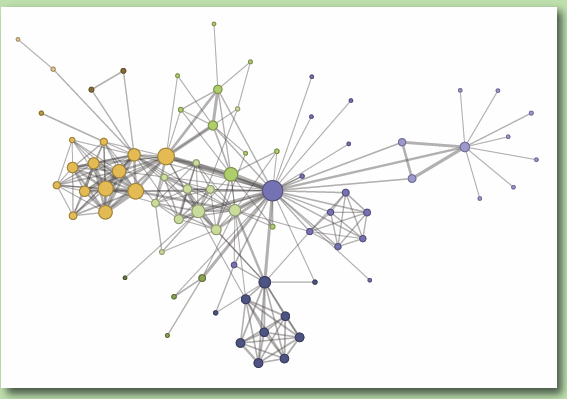
  • Network: Force-directed Layout


  • Arc Diagram


  • Matrix View


Reference
  1. Jeffrey, Heer, Bostock Michael, and Ogievetsky VADIM. "A Tour through the Visualization Zoo." Communications of the ACM 53.6 (2010): 56-67.