This paper introduced the basic figure plots for data visualization. The mentioned schemes included:
- Time Series Data: Index Chart

- Time Series Data: Stacked Graph

- Time Series Data: Small Multiples

- Statistical Distribution: Horizon Graph

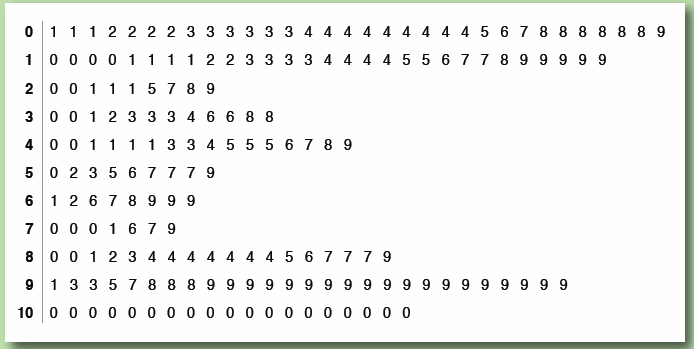
- Statistical Distribution: Stem-and-Leaf Plot
- Statistical Distribution: Q-Q Plots

- Statistical Distribution: Scatter Plot

- Statistical Distribution: Parallel Coordinates

- Maps: Flow Map

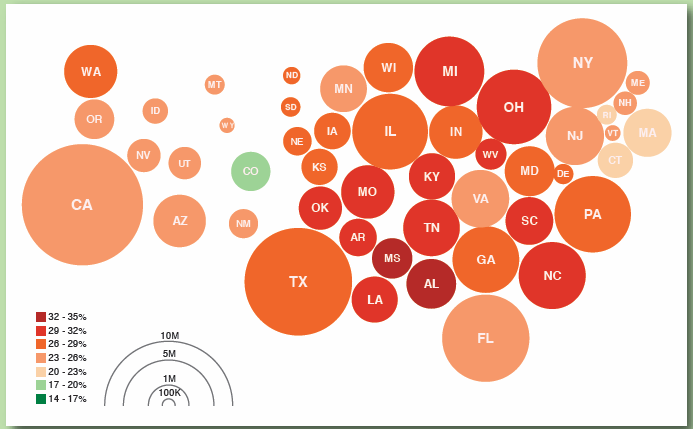
- Maps: Choropleth Map


- Hierarchies: Node-Link


- Adjacency Diagrams: Lcicle Tree Layout

- Adjacency Diagrams:Enclosure Diagrams

- Network: Treemap

- Network: Nested Circles

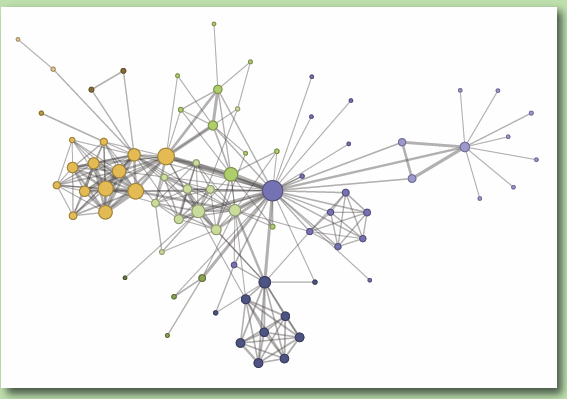
- Network: Force-directed Layout
- Arc Diagram

- Matrix View

Reference
- Jeffrey, Heer, Bostock Michael, and Ogievetsky VADIM. "A Tour through the Visualization Zoo." Communications of the ACM 53.6 (2010): 56-67.
I found that site very usefull and this survey is very cirious, I ' ve never seen a blog that demand a survey for this actions, very curious... Toledo Zoo
ReplyDelete